


Acknowledgements
This study was funded by Women and Gender Equality Canada (WAGE). The author would like to thank the following people for their helpful comments: Évelyne Bougie, Douwere Grékou, Sylvie Guilmette, Amélie Lafrance-Cooke, Danny Leung, Horatio Morgan, Patrice Rivard and WAGE examiners.

Abstract
This article examines the socioeconomic characteristics of Black business owners in Canada and compares them with the characteristics of their White Canadian and other racialized counterparts. It also explores the characteristics of businesses based on the racial profile of owners. The analysis is based on a new linkage between the Canadian Employer–Employee Dynamics Database (2018), the Census of Population (2001, 2006 and 2016) and the 2011 National Household Survey.
For the first time,
these new data provide the opportunity for a more granular analysis of trends
in business ownership by racial profile. In this paper, the term “business owners” refers to both the
owners of private incorporated businesses and the owners of unincorporated
businesses commonly referred to as self-employed workers.
The descriptive
analysis presented in this document found that Canada had an estimated 66,880 Black business
owners in 2018, accounting for 2.1% of all business owners. The proportion of Black business owners increased among both
men and women from 2005 to 2018. A total of 70.4% of
Black business owners are men, while 29.6% are women. Black business owners are generally immigrants, and, compared with their White or other racialized counterparts, they have lower incomes on average, are less likely to be married or in a common-law relationship, and are more likely to be single.
Black owners hold 2.9%
of unincorporated businesses and 1.6% of incorporated businesses; they operate
in almost all industries. Regardless
of the type of business, those owned by Black people are on average smaller
than those owned by White people or other racialized individuals. In addition, the financial performance of Black-owned
businesses is on average weaker than that of
White-owned businesses or businesses owned by people from other racialized
groups.
1 Introduction
The ethnocultural composition of the
Canadian population has changed considerably in recent decades. According to data from the Census of Population, the
proportion of people from racialized groupsNote
almost doubled between 2001 and 2021, rising from 13.4% to 26.6%. Data from the 2021 Census highlight the differences between
racialized groups and White Canadians (White people) with respect to employment
and income. Regardless of their sex,Note
although they are more active in the labour market than their White
counterparts, racialized people were more likely to be unemployed. For example, racialized groups had a labour force
participation rate of 67.9%, compared with 62.2% for White people, and an
unemployment rate of 12.5%, compared with 9.5% for their White counterparts.Note
In 2021, the Black community (4.3%), the
third-largest racialized group after the South Asian (7.1%) and Chinese (4.7%)
populations, had an unemployment rate of 14.3%, the fifth highest of the 12
racialized groups reported in the census. In addition,
Black men had the lowest income levels compared with other men. In 2020, the annual employment income of Black women and men
averaged 84% and 69% that of their White counterparts, respectively.
To deal with these unfavourable labour market conditions, Black people and other racialized groups may turn to entrepreneurship. Business ownership can be an important driver of economic growth by promoting innovation and job creation. At the individual level, business ownership is generally associated with higher incomes than non-business owners (Grékou and Gueye, 2021). However, as with wage employment, there may be differences between racialized groups and White people in terms of business ownership. Unfortunately, unlike in the United States of America, few studies based on Canadian data have examined the characteristics of racialized business owners, maybe because of a lack of data on business ownership by racial identity. The Survey on Financing and Growth of Small and Medium Enterprises (SFGSME) and the Canadian Survey on Business Conditions (CSBC) collect information on the majority racial group that owns a business. While the results of these surveys provide the proportion of businesses that are majority-owned by racialized groups, the surveys are at the business level and do not provide information about the intersection with some individual characteristics of the owners.
Business ownership among Black people
was identified as an area with a major lack of information. In 2020, members of the Parliamentary Black Caucus said that
it is hard to change what cannot be measured,Note referring to the lack of data on
the constraints faced by Black businesses and entrepreneurs in Canada. In December
2021, the federal government announced the creation of the Black
Entrepreneurship Knowledge Hub.Note
Under the responsibility of Innovation, Science and
Economic Development Canada, the purpose of the hub is to conduct qualitative
and quantitative research on business ownership in the Black community in
Canada.
The purpose of this article is to fill the information gap
by drawing a socioeconomic portrait of business owners (self-employed or owners
of private incorporated businesses) in Canada by race. For
the first time in Canada, time series on business ownership by individuals who
identify as racialized are being made available. The
article also explores the characteristics of Black-owned businesses and
compares them with businesses owned by other racialized people or by White
people. To do this, the article is based on a unique linkage
of the Canadian Employer‒Employee Dynamics Database (CEEDD); the Census
of Population (2001, 2006 and 2016); and the National Household Survey, which
replaced the 2011 Census long-form questionnaire. The
CEEDD is used to identify business owners, their characteristics and those of
their businesses, while information on race is drawn from census data.
The data produced for this project
provide an opportunity for a more granular analysis of trends in business
ownership by racial profile. In addition, they can potentially
be used to analyze microdata, including the intersection with other
characteristics of businesses and their owners. As a
result, these new series will provide decision makers with evidence to support
them in developing public policy and adapted support programs (such as the
Black Entrepreneurship Program launched by the federal government in 2021).
This article is divided into five
sections. The following section presents the data and
methodology. The third section compares the
characteristics of Black business owners with those of other racialized groups
and White people. The fourth
section looks at the characteristics of businesses by the racial profile of their
owners, and the fifth section presents the conclusion.
2 Data
and Methodology
The data used in
this article are from the 2018 Canadian Employer–Employee Dynamics Database
(CEEDD), the Census of Population (2001, 2006 and 2016) and the 2011 National
Household Survey (NHS). The CEEDD was created and is maintained by Statistics Canada and is the result of a linkage of Statistics Canada’s Business Register with a set of personal and business tax files and other administrative data. The CEEDD identifies
business owners and their individual and family characteristics, including sex,
age, marital status and immigration status. It also
includes business characteristics, such as industry, number of employees, sales
and investments. See Green et al. (2016) for more information on the CEEDD. The Census of Population long-form questionnaire collects
information on whether an individual belongs to a racialized group. The Employment Equity Act defines visible minorities as
“persons, other than Aboriginal peoples, who are non-Caucasian in race or
non-white in colour.”
Given that the long-form questionnaire is sent to a sample
of the population, linking census and NHS data to the CEEDD helped to determine
the racial profile of 47.8% of business owners. Two
identification methods were used to assign a racial profile to business owners
who did not have to complete the long-form questionnaire. The first was based on the work of Rezai et al. (2013), which classified immigrants into a racialized group
according to their country of birth and mother tongue. Using
the sample of business owners who responded to the long-form questionnaire as a
baseline for validation showed that the results of this method were 91.9%
accurate for identifying Black individuals and 96.4% accurate for identifying
other racialized groups. Applying this method made it
possible to establish the racial profile of 62.0% of business owners (including
those already identified in the census and the NHS).
Since the country of birth and mother
tongue are available in the CEEDD only for immigrants, a mass imputation method
was used to assign a racial profile to non‑immigrant owners who did not
complete the long-form questionnaire. This method
consists of creating imputation classes from variables related to the one
needing imputation. The imputation classes created for
this project were based on the person’s age, sex, income and postal code. This method filled in the missing information for specific
individuals from available data on individuals with similar characteristics.
Gueye et al. (2022) discuss in
detail this imputation methodology and the validation exercises that were
conducted.
When the analysis is limited to owners
identified in the census or the NHS, the proportion of Black business owners is
1.4% versus 2.8% for a sample containing only imputed records or records
for which the racial profile is determined using the methodology by Rezai et al. (2013). The rate of owners identified as belonging to a
racialized group is also higher in this group. These
differences are attributable in part to a higher proportion of immigrants
within the group for which the racial profile was assigned according to the methodology used by Rezai et al. (2013) or imputed
(28.5% versus 17.3%). Black permanent resident immigrants
represented 62.7% of the Black population aged 15 years and older in 2021 (2021
Census). Of the other racialized groups, 72.3% have an
immigrant background. When temporary residents are
added, 70.7% of Black individuals and 81.5% of other racialized groups in
Canada in 2021 were immigrants.Note
For the sake of brevity, the rest of the
article does not differentiate between the observed group and the group whose racial
profile was imputed or determined using the methodology of Rezai et al. (2013). The analytical sample is limited to business owners
who were at least 15 years old in 2018. In this
article, unless otherwise specified, the term “business owner”Note refers
to both the owners of a private incorporated business and the owners of an
unincorporated business commonly referred to as self-employed workers.Note The owners of an unincorporated business, who are not required to have a business number, are excluded from the analytical sample.Note
It should be noted that there are differences between Black
people, White people and other racialized groups with respect to the type of
business generally owned. Since becoming self-employed
is less expensive than starting a private business, the financial constraint is
less drastic for Black people, who have among the lowest income levels. Self-employment therefore becomes a more accessible option for
them. As reported by Baldwin et al. (2011), entrepreneurs often start with an unincorporated
business before making the transition to incorporation if they can cover the
cost and establish the organizational form required to limit liability.
While the data and methodology used in
this article produce reliable aggregate results that are comparable with other
data sources, it is important to note that they are not without limitations.
First, the fact that racial identity is imputed for
approximately 38% to 42% of business owners is a potential source of bias in the
results. Second, the classification method of Rezai et al. (2013) is also associated with a margin of error of
4% to 8%, which is an additional source of inaccuracy.
This article examines a number of individual
and business characteristics but omits a few that may have differences between business
owners belonging to different groups. At the individual
level, having work experience, having previous business ownership, living in a rural
area or having children aged younger than 16 years are factors that may
influence the propensity for business ownership but are not included in this
study. In addition, the education level, holding of a managerial
position or mother tongue (for non-immigrants) are characteristics that may be
useful but are not yet available in the CEEDD. Therefore,
several other avenues of research can clearly be considered. This study is limited to business owners, but it may be useful
to consider differences and similarities in business ownership rates between the
Black population and other groups. Such research would help
to both assess the representativeness of the Black community in business
ownership and compare the results with those from the United States, where
research on the entrepreneurship of African Americans is more extensive.
3 Who are Black
business owners in Canada?
This section provides a comparative
analysis of selected individual and family characteristics of Black business
owners compared with those of their White counterparts and other racialized
counterparts.
3.1 More
than two-thirds of Black business owners are men
In Canada, the number of Black business
owners is estimated at 66,880 in 2018, representing 2.1% of all business owners (Table 1).
More than two-thirds (70.4%) of Black business owners are
men, and 29.6% are women. Regardless of their race, men
make up the largest proportion of business owners. The
gap between men and women is proportionally higher among the Black population.
For both men and women, the proportion of Black business
owners is lower than for Black individuals in the general population. In 2018, 2.4% of male business owners belonged to the Black
community, while Black people represented 3.0% and 3.7% of working-age men (15
years and older) according to the 2016 and 2021 censuses, respectively. Among female business owners, 1.7% were identified as Black,
but 3.1% (2016) and 3.8% (2021) of women aged 15 years and older came from the
Black community. The situation is different for other
racialized groups, among whom the proportion of male and female business owners
is higher than their proportion in the general population aged 15 years and
older.
3.2 The
proportion of Black business owners has increased over time
One of the benefits of linking the CEEDD
with the census is that it provides, for the first time, an opportunity to analyze trends in business ownership among racialized groups. Chart 1 shows that the proportion of owners of incorporated businesses and unincorporated businesses (self‑employed workers) who identify as members of the Black community increased between 2005 and 2018 for both men and women but at different rates. The proportion of Black men among self-employed men almost doubled during this period, from 1.8% in 2005 to 3.5% in 2018. Among women, the percentage of Black women among self-employed workers also increased (from 1.3% to 2.2%) but less quickly than for men, thus widening the gender gap in self-employment. The share of Black people among the owners of incorporated businesses also increased. Black women, who accounted for 1.0% of female owners of an incorporated business in 2005, accounted for 1.5% of them in 2018. The same was true for men, where the proportion of Black men among those who owned an incorporated business increased 0.6 percentage points, from 1.1% in 2005 to 1.7% in 2018. The fact that the proportion of Black people is increasing faster among self-employed workers than among incorporated business owners can be explained by differences in characteristics between the various legal forms of a business. In fact, incorporated businesses are generally larger, are more productive and use more capital than unincorporated businesses (Baldwin et al., 2011). Incorporated businesses therefore require a larger initial
investment.
| Men | Women | Total | |
|---|---|---|---|
| number | |||
| White people | 1,475,880 | 861,470 | 2,337,350 |
| Black people | 47,075 | 19,805 | 66,880 |
| Other racialized groups | 471,945 | 254,920 | 726,865 |
| Total | 1,994,900 | 1,136,190 | 3,131,090 |
| percent | |||
| White people | 74.0 | 75.8 | 74.6 |
| Black people | 2.4 | 1.7 | 2.1 |
| Other racialized groups | 23.7 | 22.4 | 23.2 |
| Total | 100.0 | 100.0 | 100.0 |
Data table for Chart 1
| Self-employed, men | Self-employed, women | Private incorporated business owners, men | Private incorporated business owners, women | |
|---|---|---|---|---|
| percent | ||||
| 2005 | 1.8 | 1.3 | 1.1 | 1.0 |
| 2006 | 1.8 | 1.4 | 1.2 | 1.0 |
| 2007 | 2.0 | 1.5 | 1.3 | 1.1 |
| 2008 | 2.0 | 1.6 | 1.3 | 1.1 |
| 2009 | 2.2 | 1.7 | 1.3 | 1.2 |
| 2010 | 2.1 | 1.7 | 1.4 | 1.2 |
| 2011 | 2.1 | 1.7 | 1.4 | 1.2 |
| 2012 | 2.3 | 1.7 | 1.5 | 1.3 |
| 2013 | 2.4 | 1.7 | 1.5 | 1.3 |
| 2014 | 2.5 | 1.8 | 1.6 | 1.4 |
| 2015 | 2.6 | 1.9 | 1.6 | 1.4 |
| 2016 | 2.8 | 2.0 | 1.7 | 1.4 |
| 2017 | 3.1 | 2.1 | 1.7 | 1.5 |
| 2018 | 3.5 | 2.2 | 1.7 | 1.5 |
3.3 More than half of Black
business owners are immigrants
The vast majority of Canadians who
identify as belonging to a racialized group have an immigrant background. The data from the 2021 Census of Population show that 70.9% of
racialized individuals aged 15 years and older in Canada are immigrants; the
proportion is 62.7% among the Black population. These
data are consistent with the distribution of business owners by race and
immigrant status. Immigrants represent 64.8% of Black male
business owners and 67.9% and 70.9% of women and men
in other racialized groups, respectively (Chart 2). With
the exception of White people, Black women are less likely to be immigrants; immigrants
nonetheless account for more than half of Black female business owners. Most immigrant business owners have been in Canada for more
than five years.
Black female business owners (46.5%) are
more likely to have been born in Canada than their male counterparts (35.2%).
The same is true for other racialized groups, but the gap
between men (29.0%) and women (32.1%), while statistically significant, is
smaller.
The fact that most Black or racialized business owners are immigrants is an interesting result. As reported by Picot and Ostrovsky (2021), the literature has established that the higher self-employment rate among immigrants is in part because of the constraints they face in finding suitable paid employment. Immigrants
may not be aware of the funding and support opportunities available to them;
this unawareness would be an obstacle in terms of performance and growth. A report by the Canadian Black Chamber of Commerce (2021)
indicates that, generally speaking, the Black community is not aware of the
financing programs offered by the Business Development Bank of Canada or by
Export Development Canada. This finding is also
reflected in the Canadian Survey on Business Conditions from the second
quarter of 2021.Note
Businesses owned by racialized groups (12.0%) in general or
the Black population in particular (13.6%) were twice as likely as all
businesses (5.9%) to be unaware of the support or credit programs related to
the COVID-19 pandemic. Moreover, it could be more
difficult for immigrants to access credit at financial institutions because a
good credit score takes years to build. Leung et al.
(2018) determined that immigrants are less likely to obtain
credit from formal financial institutions.

Data table for Chart 2
| White people | Black people | Other racialized groups | ||||
|---|---|---|---|---|---|---|
| Men | Women | Men | Women | Men | Women | |
| percent | ||||||
| Recent immigrants | 0.8 | 0.6 | 10.2 | 6.4 | 10.6 | 7.5 |
| Established immigrants | 7.6 | 7.3 | 54.6 | 47.1 | 60.3 | 60.4 |
| Non-immigrants | 91.6 | 92.1 | 35.2 | 46.5 | 29.0 | 32.1 |
3.4 More than half of Black immigrant business owners come from
five countries
Given that more than half of Black
owners have an immigrant background, it is important to examine their countries
of origin. A Statistics Canada article (2019a) revealed
that until 1990, most Black immigrants to Canada came from the Caribbean and
Bermuda—mainly from Haiti and Jamaica. However, the
distribution has changed since the early 1990s; 65.1% of Black immigrants admitted
between 2011 and 2016 come from Africa—mainly Nigeria, Cameroon and the
Democratic Republic of the Congo. These distributions
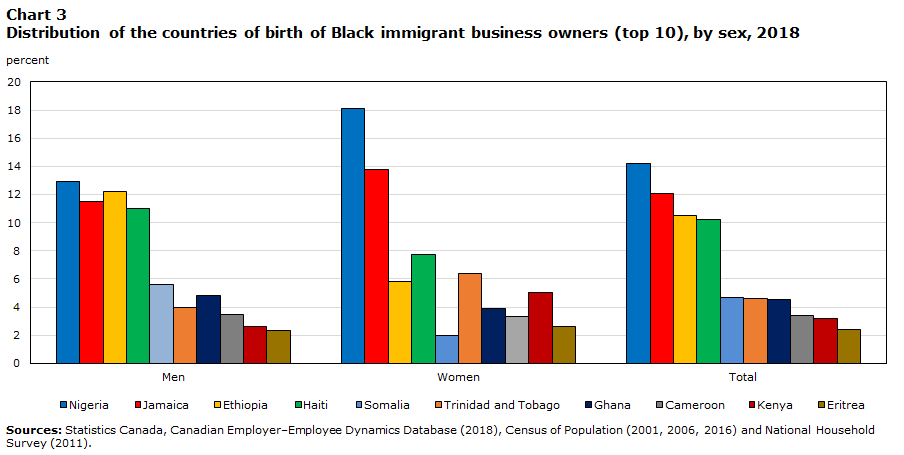
are consistent with the distributions of Black immigrant business owners. The top five countries of origin of Black immigrant business
owners are Nigeria (14.2%), Jamaica (12.1%), Ethiopia (10.5%), Haiti (10.2%)
and Somalia (4.7%); these countries represent more than half of these owners
(Chart 3). Among both men and women, close to 70%
of immigrant business owners come from 10 countries located either in the Caribbean
and Bermuda or in Africa. Except for the top 10
countries, the Democratic Republic of the Congo (2.3%) is the only one of the
hundred other countries of birth to have a proportion of Black immigrant
business owners of more than 2.0%.
Using the Longitudinal Immigration
Database, which is a component of the CEEDD, Li (2001) showed that the country
of origin can affect the probability of a person becoming self‑employed.
He determined that immigrants from Western Europe or West
Asia were more likely to be business owners than their counterparts from Africa
or the Caribbean—the main regions of origin of the Black population in Canada.
Data table for Chart 3
| Men | Women | Total | |
|---|---|---|---|
| percent | |||
| Nigeria | 12.9 | 18.1 | 14.2 |
| Jamaica | 11.5 | 13.8 | 12.1 |
| Ethiopia | 12.2 | 5.8 | 10.5 |
| Haiti | 11.0 | 7.7 | 10.2 |
| Somalia | 5.6 | 2.0 | 4.7 |
| Trinidad and Tobago | 4.0 | 6.4 | 4.6 |
| Ghana | 4.8 | 3.9 | 4.5 |
| Cameroon | 3.5 | 3.3 | 3.4 |
| Kenya | 2.6 | 5.0 | 3.2 |
| Eritrea | 2.3 | 2.6 | 2.4 |
3.5 The proportion of Black Business owners is higher in Ontario
and Quebec, the provinces with the largest Black populations
The vast majority (73.9%) of Black
Canadian business owners in Canada live in Ontario or Quebec. Ontario alone (50.6%) accounts for just over half of Black
business owners, while 23.3% live in Quebec (Table 2). They are followed by Alberta (15.0%) and British Columbia
(5.4%). This finding is consistent with both the
distribution of the Black population aged 15 years and older and the results of
a survey of 700 Black female business owners in Canada conducted by the Black
Business and Professional Association (BBPA). Most
business owners from a racialized group other than Black settle in Ontario
(51.4%) and British Columbia (21.9%). Furthermore,
while the number of White business owners is highest in Ontario, its proportion
(33.7%) is nevertheless lower than the proportions of Black and other
racialized business owners.
The rate of Black business ownership is
higher in the provinces where there is a large Black community. Ontario (2.8%), Quebec (2.5%) and Alberta (2.2%) have the
highest rates of Black ownership among the provinces, and this may suggest that
Black owners offer products and services that are generally intended for their
communities. For example, a restaurant owner who
specializes in Haitian cuisine would be more likely to settle in the Montréal
metropolitan area, home of the largest proportion of Haitians in Canada. In the BBPA survey, 87.9% of respondents said that they had
started a business because they saw an opportunity to offer goods or services.
In addition, some of these female entrepreneurs reported
that their primary motivation for starting a business came from a desire to
meet the needs of their community.
| Distribution of business owners, by racial profile and province | Rate of business ownership for each racial group, by province | |||||
|---|---|---|---|---|---|---|
| White people | Black people | Other racialized groups | White people | Black people | Other racialized groups | |
| percent | ||||||
| Newfoundland and Labrador | 0.9 | 0.1 | 0.1 | 96.5 | 0.3 | 3.1 |
| Prince Edward Island | 0.5 | 0.1 | 0.1 | 93.0 | 0.3 | 6.7 |
| Nova Scotia | 2.3 | 1.2 | 0.6 | 91.8 | 1.3 | 6.9 |
| New Brunswick | 1.8 | 0.4 | 0.3 | 94.7 | 0.7 | 4.7 |
| Quebec | 23.0 | 23.3 | 9.6 | 86.4 | 2.5 | 11.1 |
| Ontario | 33.7 | 50.6 | 51.4 | 66.1 | 2.8 | 31.1 |
| Manitoba | 3.6 | 2.1 | 1.8 | 85.3 | 1.4 | 13.3 |
| Saskatchewan | 5.0 | 1.6 | 1.3 | 91.7 | 0.8 | 7.5 |
| Alberta | 15.1 | 15.0 | 12.9 | 77.4 | 2.2 | 20.4 |
| British Columbia | 13.9 | 5.4 | 21.9 | 66.9 | 0.7 | 32.4 |
| Territories | 0.2 | 0.2 | 0.1 | 86.7 | 2.7 | 10.6 |
3.6 Black business owners are on
average six years younger than their White counterparts
For both men and women, Black business
owners and those from other racialized groups are on average 47 years of age, 6
years younger than their White counterparts (53 years) (Chart 4). The Black population is younger than the general population in
Canada. Among Black people, 80.6% of men and 78.7% of
women are aged younger than 50 years (Statistics Canada, 2019b), while the
proportion in the total population is 63.4% and 61.3% for
men and women, respectively. Despite the young Black
population, the vast majority of business owners in this community are aged
older than 40 years.Note This finding suggests that there is a need to gain experience
and accumulate capital, two criteria that are generally acquired over time
(Shinnar and Young, 2008).

Data table for Chart 4
| White people | Black people | Other racialized groups | |
|---|---|---|---|
| years | |||
| Men | 53 | 47 | 47 |
| Women | 53 | 47 | 47 |
3.7 Black business owners are less likely to be married or in a
common-law relationship than their White counterparts or other racialized
counterparts
Several studies have found that family
composition is a factor that can influence the decision about whether to start
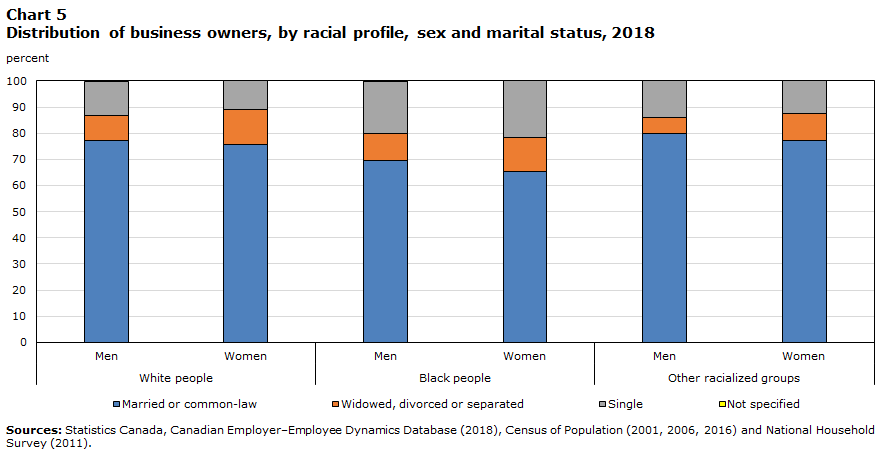
a business (Lin et al., 2000; Ozcan, 2011; Eliasson and Westlund, 2013). Grékou and Gueye (2021) showed that the likelihood of owning a business is higher among people who are married or in a common-law relationship and among widowed, divorced or separated individuals than among single people. Budig
(2006) argued that the positive effect marriage has on the probability of
starting a business can be explained by the increase in family wealth. Among both men and women, Black people (69.6% for men and
65.3% for women) were not only less likely to be in a relationship, but also
more likely to be single (Chart 5). In addition,
people from other racialized groups (77.4% for women and 80.0% for men) are more likely
to be married or in a relationship than White and Black people, regardless of
sex. These differences could help explain possible
disparities between groups in terms of access to or retention of business
ownership.
3.8 The incomes of Black business owners are lower on average
than the incomes of White people or other racialized groups
Despite the continued diversification of the Canadian
population, inequalities in income and access to employment can still be
observed between racialized groups and White people. Data from the 2021 Census
show that people who identify as belonging to a racialized group are more
likely than White people to be unemployed, even though they are more active in the
labour market.
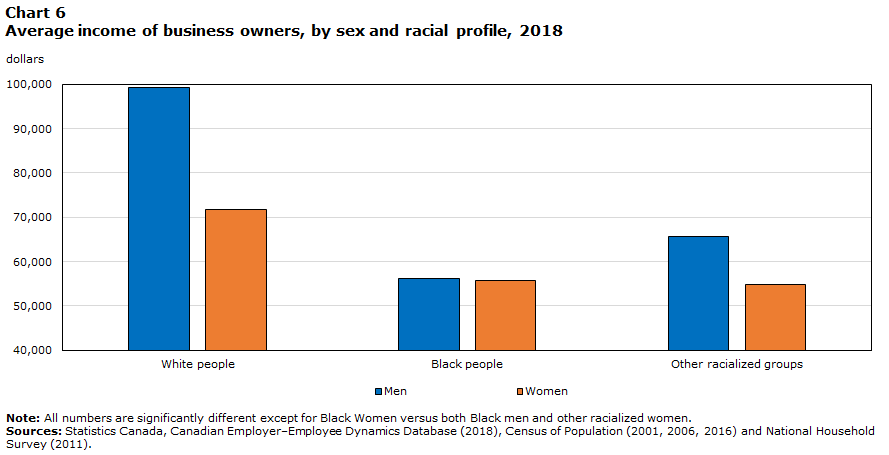
In addition, the total income before tax of racialized men
is on average $11,140 less than that of their White counterparts. The gap is
smaller for women, but still in favour of White people (+$5,560 than the income of
women belonging to racialized groups). These income differences between White
people and racialized groups within the general population are also noticeable
among business owners. Among male business owners, the incomes of Black
individuals ($56,100) are the lowest on average (Chart 6). They earned $9,500
less than their counterparts from other racialized groups and $43,300 less than
White men. There is no statistically significant difference between Black women
($55,700) and their racialized counterparts ($54,800). However, on average,
they earned more than $16,000 less than White women.
Financial considerations are an important factor for the
creation or survival of a business (Evans and Leighton, 1989; Leung et al.,
2018; Grékou and Gueye, 2021). In the BBPA study, 81.4% of Black female
business owners reported having used their own funds to start their business.
Some added that access to financing and the costs of loans are major obstacles
to owning a business. This finding is consistent with the hierarchical theory
of Myers and Majluf (1984) that personal funds are the primary source of
financing, followed by loans. Considering the importance of financial resources
in business ownership, the low level of income of Black individuals compared
with White individuals and other racialized groups could be an obstacle for
both owners (staying in business and growing) and employees (accessing business ownership).
Data table for Chart 5
| White people | Black people | Other racialized groups | ||||
|---|---|---|---|---|---|---|
| Men | Women | Men | Women | Men | Women | |
| percent | ||||||
| Married or common-law | 77.3 | 75.8 | 69.6 | 65.3 | 80.0 | 77.4 |
| Widowed, divorced or separated | 9.6 | 13.4 | 10.2 | 13.1 | 6.0 | 10.0 |
| Single | 13.0 | 10.8 | 20.1 | 21.6 | 14.0 | 12.6 |
| Not specified | 0.0 | 0.0 | 0.1 | 0.0 | 0.0 | 0.0 |
Data table for Chart 6
| White people | Black people | Other racialized groups | |
|---|---|---|---|
| dollars | |||
| Men | 99,400 | 56,100 | 65,600 |
| Women | 71,800 | 55,700 | 54,800 |
3.9 Black people are more likely to be new business owners than White people and other racialized groups
In this section, recent immigrants were
removed from the sample as it is possible that they were not in Canada between
2013 and 2017. After having determined the racial
profile of business owners in 2018,Note the longitudinal
nature of the CEEDD helped to determine whether they were also business owners
in previous years, given that their 2018 racial profile is assumed to be the
same across time.
Among Black male business owners in 2018, 48.1% were in business throughout the period from 2013 to 2017, compared with 57.9% for men belonging to other racialized groups and 72.5% for White people (Table 3). This is also true among women who were business owners in 2018; the proportion who were also business owners between 2013 and 2017 is lower among Black women (46.3%) than among their White (66.2%) or other racialized (53.5%) counterparts.
Conversely, among Black men, 14.0% of business owners were entrants, or individuals who were not business owners between 2013 and 2017 but became owners in 2018, compared with 9.4% among men from other racialized groups and 5.5% among White men. The same is true for Black women (13.9%) compared with White women (6.9%) and women from other racialized groups (9.8%).
These differences in the number of years
of activity as a business owner between 2013 and 2017 could be related to the
type of ownership.Note
Grékou and Liu (2018) determined that self-employed people
had lower survival rates than owners of private incorporated businesses. A study focusing on motivations to enter or exit business
ownership would help to determine whether survival is less likely among Black
people because of their employment situation. For
example, did the Black people who became self-employed do so to get out of
unemployment or did they end their business activities as soon as they found
payroll employment?
| Years as an owner | White people | Black people | Other racialized groups | |||
|---|---|---|---|---|---|---|
| Men | Women | Men | Women | Men | Women | |
| percent | ||||||
| 0 | 5.5 | 6.9 | 14.0 | 13.9 | 9.4 | 9.8 |
| 1 | 5.5 | 6.9 | 12.1 | 11.8 | 8.8 | 10.0 |
| 2 | 5.6 | 7.0 | 9.5 | 10.5 | 8.2 | 9.6 |
| 3 | 5.2 | 6.3 | 8.0 | 8.8 | 7.6 | 8.6 |
| 4 | 5.9 | 6.7 | 8.3 | 8.6 | 8.0 | 8.4 |
| 5 | 72.5 | 66.2 | 48.1 | 46.3 | 57.9 | 53.5 |
4 Which types of
businesses do Black individuals own?
In this second part of the article, the
unit of analysis is the business, to determine whether the characteristics of
businesses vary according to the majority racial profile in business ownership.
Since private incorporated businesses generally differ from
unincorporated businesses (Baldwin and Rispoli, 2010; Baldwin et al., 2011),
they will be examined separately. A methodology based
on the work of Grékou et al. (2018) to identify
businesses owned by women and men was used to assign a racial profile to a
business. A business is said to belong to a racial
group (White people, Black people and other racialized groups) if more than
half of its shares are held by individuals who identify with that group. In the event of equal shares, the business is assigned to
Black people and to other racialized groups (in this order). For example, if Black people and those from other racialized
groups each hold 50% of the shares, the business is said to be owned by Black
people. However, when White people and other racialized
groups each hold 50%, the business is said to be owned by another racialized
group.
4.1 Black
people own a higher proportion of unincorporated businesses than private
incorporated businesses
Table 4 shows that 2.9% of unincorporated businesses
and 1.6% of incorporated businesses are Black-owned. This finding indicates that Black people are more likely to be
unincorporated self-employed workers than incorporated business owners. Individuals belonging to other racialized groups own 21.8% of
unincorporated businesses and 24.2% of incorporated businesses.
An alternative definition to majority
ownership is participation, meaning that a business
would be considered Black if at least one of the owners identified as Black.
According to this definition, 3.1% of unincorporated
businesses and 2.2% of incorporated businesses are owned by Black people. The fact that the two definitions produce almost similar
results for Black people suggests that Black business owners tend to be sole
proprietors or associate with other Black people. The definition
based on majority ownership will be used in the remainder of the article.
| Race | Unincorporated businesses | Private incorporated businesses | All private businesses |
|---|---|---|---|
| number | |||
| White people | 854,600 | 1,013,700 | 1,868,300 |
| Black people | 32,600 | 22,200 | 54,800 |
| Other racialized groups | 247,100 | 329,800 | 576,800 |
| Total | 1,134,300 | 1,365,600 | 2,499,900 |
| percent | |||
| White people | 75.3 | 74.2 | 74.7 |
| Black people | 2.9 | 1.6 | 2.2 |
| Other racialized groups | 21.8 | 24.2 | 23.1 |
| Total | 100 | 100 | 100 |
4.2 Transportation and warehousing, and professional, scientific
and technical services are the main fields of activity of Black-owned businesses
The distribution by industry—defined by
the two-digit North American Industry Classification System code—is almost the
same for unincorporated businesses, whether they are owned by Black people,
White people or other racialized groups. The
transportation and warehousing industry (34.3%) has the largest number of
Black-owned unincorporated businesses (Table 5). It
is followed by real estate and rental and leasing (13.4%) and professional,
scientific and technical services (10.4%), which represent the first- and third-largest
industries of unincorporated businesses owned by White people or other
racialized groups. The transportation and warehousing industry
(19.8%) has the second-largest number of unincorporated businesses owned by
other racialized groups. The agriculture, forestry,
fishing and hunting industry, the second largest for unincorporated businesses
owned by White people (17.7%), accounts for 1.1% and 1.5%, respectively, of
businesses owned by Black people and other racialized groups. The construction industry and the administrative and support,
waste management and remediation services industry round out the top five industries
for private unincorporated businesses owned by Black people or other racialized
groups.
Among private incorporated businesses, professional, scientific and technical services account for the largest number of businesses, regardless of the racial group to which the owners belong (17.7%,
21.3% and 19.8% for businesses owned by White people, Black people and other
racialized groups, respectively). Transportation and
warehousing (14.2%), health care and social assistance (12.3%), construction
(9.8%), and retail trade (7.8%) are the other four industries that include the
largest number of private incorporated businesses owned by Black people. These industries are also the top five for businesses owned by
other racialized groups, but in a different order than that of Black people.
The distribution by industry of
Black-owned private incorporated businesses is comparable to that of businesses
owned by other racialized groups but somewhat different from that of White-owned
businesses. For example, Black‑owned private
incorporated businesses are about twice as likely to be in the transportation
and warehousing or health care and social assistance industries as White-owned
businesses. The top five industries for Black-owned
private incorporated businesses account for 65.4% of all private incorporated
businesses owned by this community, while these same industries represent 52.5%
of White-owned private incorporated businesses. Conversely,
White-owned businesses have a stronger presence in agriculture, forestry,
fishing and hunting; mining, quarrying, and oil and gas extraction; and
utilities.
| Unincorporated businesses owned by | Private incorporated businesses owned by | |||||
|---|---|---|---|---|---|---|
| White people | Black people | Other racialized groups | White people | Black people | Other racialized groups | |
| percent | ||||||
| Agriculture, forestry, fishing and hunting | 17.7 | 1.1 | 1.5 | 6.0 | 0.8 | 0.6 |
| Mining, quarrying, and oil and gas extraction, and utilities | 0.8 | 0.3 | 0.3 | 1.2 | 0.3 | 0.2 |
| Construction | 11.0 | 8.3 | 8.2 | 15.4 | 9.8 | 9.8 |
| Manufacturing | 2.0 | 1.4 | 1.3 | 4.1 | 2.5 | 2.8 |
| Wholesale trade | 1.1 | 1.1 | 1.1 | 4.1 | 3.1 | 4.4 |
| Retail trade | 4.8 | 4.8 | 5.2 | 7.2 | 7.8 | 10.0 |
| Transportation and warehousing | 4.4 | 34.3 | 19.8 | 5.0 | 14.2 | 14.1 |
| Information and cultural industries | 1.5 | 1.4 | 1.3 | 1.5 | 1.5 | 1.1 |
| Finance and insurance | 1.0 | 1.3 | 1.6 | 7.4 | 3.2 | 3.5 |
| Real estate and rental and leasing | 20.2 | 13.4 | 27.8 | 7.8 | 4.7 | 5.8 |
| Professional, scientific and technical services | 14.2 | 10.4 | 11.9 | 17.7 | 21.3 | 19.8 |
| Management of companies and enterprises | 0.1 | 0.0 | 0.0 | 0.7 | 0.3 | 0.3 |
| Administrative and support, waste management and remediation services | 5.0 | 7.7 | 6.5 | 4.3 | 6.5 | 3.9 |
| Educational services | 1.1 | 1.1 | 1.1 | 1.0 | 1.3 | 1.3 |
| Health care and social assistance | 3.9 | 3.4 | 3.4 | 7.2 | 12.3 | 8.6 |
| Arts, entertainment and recreation | 3.0 | 2.8 | 1.7 | 1.4 | 1.3 | 0.7 |
| Accommodation and food services | 1.5 | 1.3 | 1.6 | 3.2 | 3.7 | 8.0 |
| Other services (excluding public administration) | 6.9 | 6.1 | 5.8 | 4.9 | 5.5 | 5.2 |
4.3 Businesses owned by Black people are on average smaller than
those owned by White people or other racialized groups
Unincorporated businesses owned by Black
people are generally smaller than those owned by other groups in terms of the
size of the business measured by the number of employees. In fact, 95.6% of unincorporated businesses owned by Black
people have fewer than one employee, compared with 92.7% and 89.6% for those
owned by other racialized groups and White people, respectively (Chart 7).
This finding is not surprising, because unincorporated
self-employed workers often carry out their activities individually. However, it should be noted that unincorporated businesses
owned by White people (10.3%) are twice as likely to have at least one
employee as businesses owned by Black people (4.4%). A
total of 7.3% of unincorporated businesses owned by other racialized groups have
at least one employee.
The distribution by employment size is less concentrated for private incorporated businesses, although more than half of them had fewer than one employee regardless of the racial profile of the owners. Black-owned private incorporated businesses are generally smaller than those owned by their White or other racialized counterparts. A total of 91.2% of Black-owned private incorporated businesses have fewer than five employees compared with 87.9% for other racialized groups and 83.1% for White people. Conversely, Black-owned businesses (8.8%) are almost half as likely as White-owned businesses (17.0%) to have five or more employees. Compared with businesses owned by other racialized groups, Black-owned businesses are 1.4 times less likely to have five or more employees.
These results reflect the importance of
small and medium-sized enterprises (SMEs) to the Canadian economy and are
consistent with those of ISEDNote
(2019), which found that in 2017, 89.6% of employment came from small (fewer
than 100 employees) and medium‑sized (100 to 499 employees) enterprises. Moreover, when only SMEs are considered, about 98% of
businesses are small, regardless of whether they belong to racialized groups
(ISED, 2020).

Data table for Chart 7
| White people | Black people | Other racialized groups | ||||
|---|---|---|---|---|---|---|
| UB | IB | UB | IB | UB | IB | |
| percent | ||||||
| less than 1 employee | 89.6 | 51.0 | 95.6 | 60.9 | 92.7 | 49.7 |
| 1 to 4 employees | 7.8 | 32.1 | 3.4 | 30.3 | 5.8 | 38.2 |
| 5 to 19 employees | 2.3 | 12.4 | 0.9 | 6.9 | 1.4 | 9.9 |
| 20 to 99 employees | 0.2 | 4.0 | 0.1 | 1.7 | 0.1 | 2.1 |
| 100 or more employees | 0.0 | 0.5 | 0.0 | 0.2 | 0.0 | 0.2 |
4.4 Financial
performance is lower for Black-owned businesses
This section is limited to private
incorporated businesses and provides some financial results for businesses by
the racial profile of owners. The literature has shown
that the financial performance of businesses varies based on certain owner characteristics
(Fairlie and Robb, 2009, for gender differences; Bemrose and Lafrance-Cooke,
2022, comparing persons with disabilities with those without disabilities).
As shown in Table 6, Black-owned
businesses perform less well financially on average than those owned by White
people or other racialized groups. In fact, Black-owned
businesses have the lowest levels of gross income and profit, followed by those
owned by other racialized groups. In addition, the
amounts reported by businesses owned by White people are on average nearly
three times higher than those reported by businesses owned by Black people and
twice as high as those of businesses owned by other racialized groups. However, spending and debt levels are lower for Black-owned
businesses.
Investment, measured by physical capital
held, is also lower on average for businesses owned by Black people ($190,800)
than for businesses owned by White people ($617,600) or other racialized groups
($274,400). The gap between Black-owned and White-owned
businesses is not attributable to the extreme values of some large White-owned
businesses that would affect the average. Median values
also reveal differences in favour of White-owned businesses over
Black-owned businesses.
These different financial performances
do not necessarily indicate that Black-owned businesses are less profitable.
The rate of return on assets (net income divided by total
assets) and profit margin (difference between income and costs expressed as a
percentage of income) are measures frequently used to estimate a business’s
profitability. Black-owned businesses (5.2%) have on
average a lower rate of return on assets than those owned by White people
(10.6%) or other racialized groups (9.3%). This means
that Black-owned businesses have a weaker capacity to use their assets to
generate gains. In addition, the profit margin is also
to the advantage of White-owned businesses (14.9% compared with 8.5% for
Black-owned businesses), meaning that White-owned businesses have a better
ability to profit from their activities and have more room to maneuver to cope
with rising costs or competition. Although these ratios
are good indicators of business profitability, they may be affected by factors
other than the racial profile of owners, such as the business sector.
Fairlie and Robb (2007) explain that
White-owned businesses in the United States are more successful than
Black-owned businesses because the latter are less likely to come from a
family of business owners and to have worked in the family business. Such a hypothesis could explain in part the differences in
performance between businesses owned by Black and White people in Canada. The vast majority of Black business owners in Canada are
immigrants and thus constitute the first generation of their families in the
country.
Unsurprisingly, the value of exports
differs according to the racial profile of the owners of the exporting
business. On average, exports of Black-owned businesses
($884,100) are equivalent to about 53% of those of businesses of other
racialized groups ($1,667,000) and 25% of exports of White-owned businesses
($3,540,000). However, the propensity to export is
comparable between businesses owned by White people, Black people or other
racialized groups. Immigration has a positive effect on
trade between Canada and the countries of origin of immigrants (Wagner, Head
and Ries, 2002). In addition, immigrant entrepreneurs
export mainly to their country of origin (Fung, Grekou and Liu, 2019; Morgan,
Sui and Malhotra, 2021), probably because of their understanding of the market needs
and their knowledge of local languages. The data used
in this document show that 31.6% of immigrant-owned exporting businesses have
exported to the country of origin of their immigrant owners. Black entrepreneurs (57.1%) are more likely to export goods
or services from Canada to their country of origin, followed by those from
other racialized groups (36.0%). Among the businesses
owned by White immigrants, 19.8% exported to the country of origin of the
owners.
| Businesses owned by | Significance test | |||||
|---|---|---|---|---|---|---|
| White people | Black people | Other racialized groups | White people and Black people | Black people and other racialized groups | White people and other racialized groups | |
| dollars | importance (p-value) | |||||
| Assets | 1,712,200 | 747,000 | 699,700 | 0.008 | 0.892 | 0.000 |
| Tangibles assets | 617,600 | 190,800 | 274,400 | 0.000 | 0.039 | 0.000 |
| Liabilities | 894,000 | 313,700 | 442,300 | 0.000 | 0.157 | 0.000 |
| Revenue | 1,211,100 | 460,300 | 645,300 | 0.000 | 0.025 | 0.000 |
| Expenses | 1,030,200 | 421,300 | 580,100 | 0.000 | 0.066 | 0.000 |
| Profit | 180,900 | 39,000 | 65,200 | 0.000 | 0.142 | 0.000 |
| Value of exports | 3,540,000 | 884,100 | 1,667,000 | 0.000 | 0.001 | 0.001 |
5 Conclusion
For the first time in Canada,
administrative data have been used to determine the intersection between the
racial profile (White people, Black people or other racialized groups) of
business owners—meaning unincorporated self-employed workers and private
incorporated business owners—and selected sociodemographic (e.g., sex, immigrant
status, age or marital status) and economic (income, ownership type and
longevity as a business owner) characteristics. This
article also explored the differences and similarities in the characteristics
of businesses owned by White people, Black people and other racialized groups.
This work, which aligns with the federal government’s
effort to fill a data gap on Black business owners to better inform public
policy, was made possible thanks to a linkage between the 2018 Canadian
Employer–Employee Dynamics Database; the 2001, 2006 and 2016 Census of
Population; and the 2011 National Household Survey. These
new data will enable a more disaggregated analysis of trends in
business ownership by racial profile combined with other individual and
business characteristics.
There were an estimated 66,880 Black business owners in 2018, the vast majority of whom were men (70.4% versus 29.6% for women). Black people account for 2.1% of all business owners, and more than half of them have an immigrant background.
On average, Black business owners and
those of other racialized groups are about six years younger than their White
counterparts. There are income gaps in favour of White
people and other racialized groups compared with Black people. In addition, Black people are not only less likely than White
people and other racialized groups to be married or in a relationship, but also
more likely to be single. Black business owners
generally reside in Ontario (50.6%) or Quebec (23.3%). Black
business ownership rates are also higher in provinces with higher Black
populations (Ontario [2.8%], Quebec [2.5%] and Alberta [2.2%]).
Black-owned businesses—defined as
businesses in which individuals who identify as Black hold more than half of
the shares—account for 2.9% of unincorporated businesses and 1.6% of
incorporated businesses. The distribution by industry
of unincorporated Black-owned businesses is comparable to that of other groups.
More than 97% of these businesses have fewer than five
employees, regardless of the racial profile of their owners.
The difference between Black-owned
businesses and those owned by White people or other racialized groups is more
apparent for private incorporated businesses. Although
professional, scientific and technical services are the industry with the
largest number of businesses for all types of owners, the distribution by
industry differs somewhat between Black- and White-owned businesses. Moreover, Black-owned businesses are generally smaller (number
of employees) than those owned by White people or other racialized groups. Income, sales, assets, investments and export value are on
average at least twice as low for Black-owned businesses compared with those
owned by White people.
Although the findings are comparable to
results from previous research, it is clear that the imputation of the racial
profile of some business owners could affect the accuracy of the data. To reduce the amount of imputed data, it is possible, for
example, to include more censuses or surveys in which racial profile
information is collected. In future research, it would
be interesting to examine the determinants of business ownership among Black
people and see how they differ from those of other groups. Such an analysis would provide a better understanding of the
factors that influence the decision of Black people to become business owners.
The CEEDD would also enable tracking the trajectory of
business owners. In other words, it would be possible
to track for a period of time a cohort whose members became business owners in
a given year and determine their performance with respect to survival and growth,
among other factors. It may also be interesting to see
how Canadian-born Black people compare with Black immigrants in terms of the
labor market in general and business ownership in particular.
Bibliography
Baldwin, J., and L. Rispoli. 2010. Productivity Trends of Unincorporated Enterprises in the
Canadian Economy, 1987 to 2005. The Canadian Productivity
Review, No. 28, Statistics Canada Catalogue no. 15-206-X. https://www150.statcan.gc.ca/n1/fr/pub/15-206-x/15-206-x2010028-eng.pdf?st=EJBaetSX
Baldwin, J., D. Leung and L. Rispoli.
2011. Labour Productivity of Unincorporated Sole
Proprietorships and Partnerships: Impact on the Canada-United States
Productivity Gap. Economic Analysis Research Paper Series, no. 71,
Statistics Canada Catalogue no. 11F0027M. https://www150,statcan.gc.ca/n1/fr/pub/11f0027m/11f0027m2011071-eng.pdf?st=bC4GbZzB
Bemrose R. and A. Lafrance-Cooke. 2022.
Business ownership among persons with disabilities in
Canada. Analytical Studies Branch: Economic and Social
Reports. Statistics Canada Catalogue no. 36-28-0001. https://www150,statcan.gc.ca/n1/pub/36-28-0001/2021012/article/00004-eng.htm
Black Business and Professional
Association, Casa Foundation, de Sedulous Women Leaders, and Women
Entrepreneurship Knowledge Hub. (2021). Rise up: A
study of 700 Black women entrepreneurs. https://wekh.ca/wp-content/uploads/2021/04/BBPA-Rise-Up.pdf
Canadian Black Chamber of Commerce. (2021). Building Black Businesses in Canada. Personas,
Perceptions & Experiences. https://www.blackbusinessbc.ca/resources/Building-Black-Businesses-in-Canada-_Feb-27-2021.pdf
Eliasson, K. and H. Westlund. 2013. Attributes influencing self-employment propensity in urban and
rural Sweden. The Annals of Regional Science, 50,
479–514.
Evans, D. S. and L. S. Leighton. 1989. Some empirical aspects
of entrepreneurship, American Economic Review, 79,519–535.
Fairlie, R. W., and Robb, A. M. (2007).
Why Are Black‐Owned
Businesses Less Successful than White‐Owned
Businesses? The Role of Families, Inheritances, and
Business Human Capital. Journal of Labor Economics,
25(2), 289–323. https://doi.org/10,1086/510763
Fairlie, R., and A. Robb. 2009. “Gender Differences in Business Performance: Evidence from the
Characteristics of Business Owners Survey,” Small Business Economics, vol. 33, no. 4, 375–395.
Fung, L., Grekou, D., Liu, H. 2019.
The Impact of Immigrant Business Ownership on International
Trade. Statistics Canada Catalogue no. 11F0019M no. 426. https://www150.statcan.gc.ca/n1/pub/11f0019m/11f0019m2019014-eng.htm
Green, D., H. Liu, Y. Ostrovsky and G.
Picot. 2016. Immigration, Business Ownership and
Employment in Canada Analytical Studies Branch Research Paper Series, no. 375
Statistics Canada Catalogue no. 11F0019M. https://www150,statcan.gc.ca/n1/fr/pub/11f0019m/11f0019m2016375-eng.pdf?st=kjiyJvGy
Grekou, D. and H. Liu. 2018. The Entry into and Exit out of Self-employment and Business
Ownership in Canada. Analytical Studies Branch Research
Paper Series, no. 407, Statistics Canada Catalogue no. 11F0019M. https://www150.statcan.gc.ca/n1/pub/11f0019m/11f0019m2018407-eng.htm
Grekou, D., J. Li and H. Liu. 2018. “The Measurement of Business Ownership by Gender in the
Canadian Employer–Employee Dynamics Database.” Analytical Studies: Methods
and References, no. 017, Statistics Canada Catalogue no. 11-633-X. https://www150.statcan.gc.ca/n1/pub/11-633-x/11-633-x2018017-eng.htm
Grekou D. and Gueye B. (2021). “Who are the Men and Women Entering Business Ownership in
Canada?” Analytical Studies Branch Research Paper Series, no. 459,
Statistics Canada Catalogue no. 11F0019M. https://www150.statcan.gc.ca/n1/pub/11f0019m/11f0019m2021002-eng.htm
Gueye, B., A. Lafrance, and J. Oyarzun.
(2022). Identifying Indigenous business owners and
Indigenous-owned businesses. Analytical Studies:
Methods and References Statistics Canada Catalogue no.
11-633-X no. 045 Ottawa: Statistics Canada. https://www150.statcan.gc.ca/n1/en/pub/11-633-x/11-633-x2022008-eng.pdf?st=RVR4G7rc
Innovation, Science and Economic
Development Canada (2019). Key Small Business
Statistics.
Innovation, Science and Economic
Development Canada. (2020). SME Profile: Ownership
demographics statistics.
Leung D., Y. Ostrovski and G. Picot
(2018). “The Financing of Immigrant-owned Firms in Canada,”
Analytical Studies Branch Research Paper Series, no. 404. Statistics
Canada Catalogue no. 11F0019M, Statistics Canada. https://www150.statcan.gc.ca/n1/pub/11f0019m/11f0019m2018404-eng.htm
Li, P. S. (2001). Immigrants’
Propensity to Self-Employment: Evidence from Canada. The
International Migration Review, 35(4), 1106–1128. http://www.jstor.org/stable/3092004
Lin, Z., G. Picot and J. Yates (2000), “The Entry and
Exit Dynamics of Self-employment in Canada,” Analytical Studies Branch Research
Paper Series no. 134, Statistics Canada catalogue no. 0-660-96130-X. The Entry and Exit Dynamics of Self-employment in
Canada – ARCHIVED (statcan.gc.ca)
Morgan, H. M., Sui, S., and Malhotra, S.
(2021). No place like home: The effect of exporting to
country-of-origin on the financial performance of immigrant-owned SMEs. Journal of International Business Studies, 52(3), 504–524.
Ozcan, B. 2011. “Only the lonely? The influence of
spouse on the transition to self-employment.” Small
Business Economics 37(4): 465–492.
Rezai, M. R., Maclagan, L. C., Donovan,
L. R., and Tu, J. V. (2013). Classification of Canadian
immigrants into visible minority groups using country of birth and mother
tongue. Open Medicine Journal, 7(4), e85–e93.
Shinnar, S.R. and C.A. Young. 2008. “Hispanic Immigrant Entrepreneurs in Las Vegas Metropolitan
Area: Motivations for Entry into and Outcomes of Self Employment.” Journal of Small Business Management, 46 (2): 242–262.
Statistics Canada, 2001 Census of
Population, Statistics Canada. Catalogue no. 97F0022XCB2001005.
Statistics Canada, 2016 Census of Population. Statistics Canada. Catalogue no.
98-400-X2016190.
Statistics Canada, 2016 Census of
Population. Statistics Canada. Catalogue
no. 98-400-X2016191.
Statistics Canada, 2016 Census of
Population. Statistics Canada. Catalogue
no. 98-400-X2016192.
Statistics Canada, 2016 Census of Population. Statistics
Canada. Catalogue no. 98-400-X2016286.
Statistics Canada. Table 98-10-0303-01 Citizenship by visible minority and
immigrant status and period of immigration: Canada, provinces and territories
and federal electoral districts (2013 Representation Order)
Statistics Canada. Table 98-10-0435-01 Labour force status by visible minority,
highest level of education, major field of study (STEM and BHASE, summary) and
immigrant status: Canada, provinces and territories, census metropolitan areas
and census agglomerations with parts.
Statistics Canada. Table 98-10-0439-01 Employment income statistics by visible
minority, highest level of education, immigrant status and income year: Canada,
provinces and territories, census metropolitan areas and census agglomerations
with parts.
Statistics Canada (2019a). Canada’s Black population: Growing in number and diversity.
Statistics
Canada [Infographic]. https://www150.statcan.gc.ca/n1/pub/11-627-m/11-627-m2019006-eng.pdf
Statistics Canada (2019a). Diversity of the Black population in Canada: An overview. Ethnicity, Language and Immigration Thematic Series.
Statistics Canada Catalogue no. 89-657-X. https://www150.statcan.gc.ca/n1/pub/89-657-x/89-657-x2019002-eng.htm
Statistics Canada. Table 33-10-0351-01 Reasons business or organization did not
access any funding or credit due to the COVID-19 pandemic, by business
characteristics, second quarter of 2021. DOI: https://www150.statcan.gc.ca/t1/tbl1/en/tv.action?pid=3310035101&request_locale=en
Wagner, D., K. Head and J. Ries. 2002.
“Immigration and the trade of provinces.” Scottish Journal of Political Economy 49 (5): 507–525.